UNIVERSITÄTSSTADT TÜBINGEN
FACTS
THAT MEET THE EYE
PUBLICATIONS // INFOGRAPHICS

When it comes to communicating multi-layered and complex topics, we are a reliable partner. This is also the case for the City of Tübingen, which we support in extensive publications with e.g. intuitive graphic implementation and attractive infographics.

To protect your personal data, the connection to the video saved on Vimeo has been blocked. By loading the video, you accept Vimeo's privacy policy.
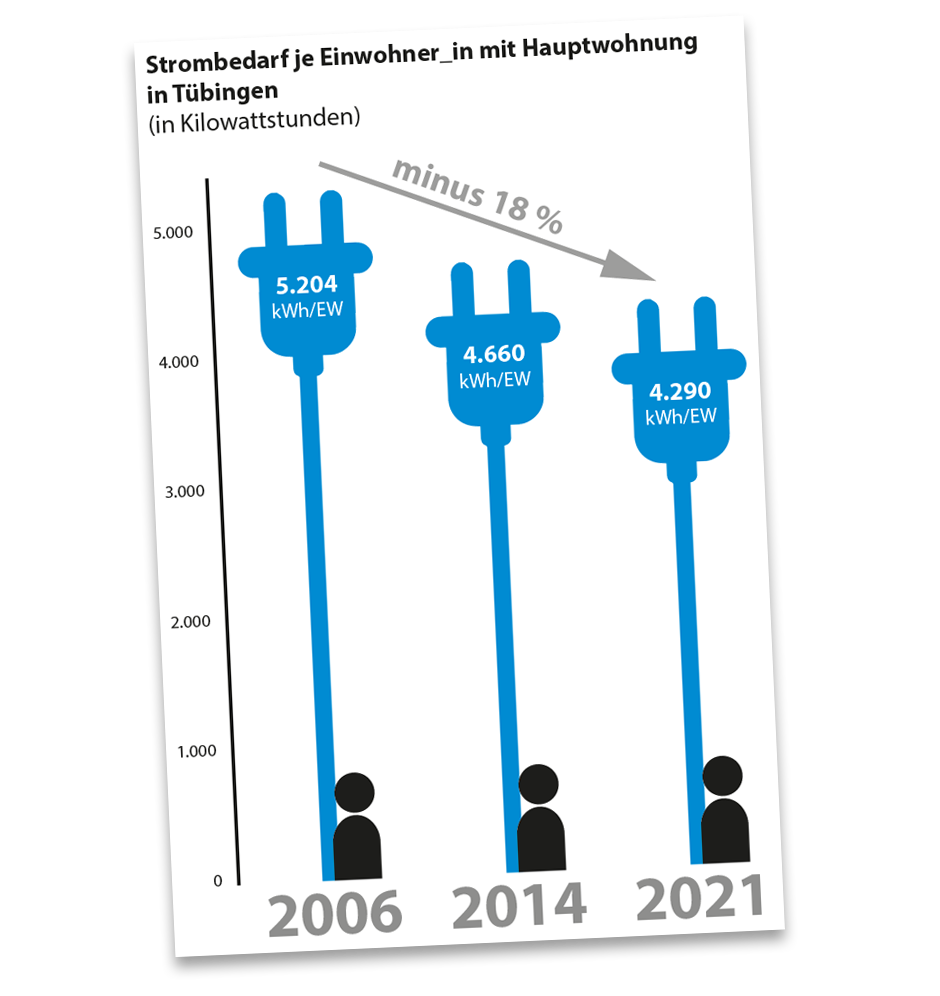
For the social report of the city, we develop a sophisticated concept which focusses on presenting a great number of divers facts and figures via attractive and intuitive info graphics, tables, and maps.
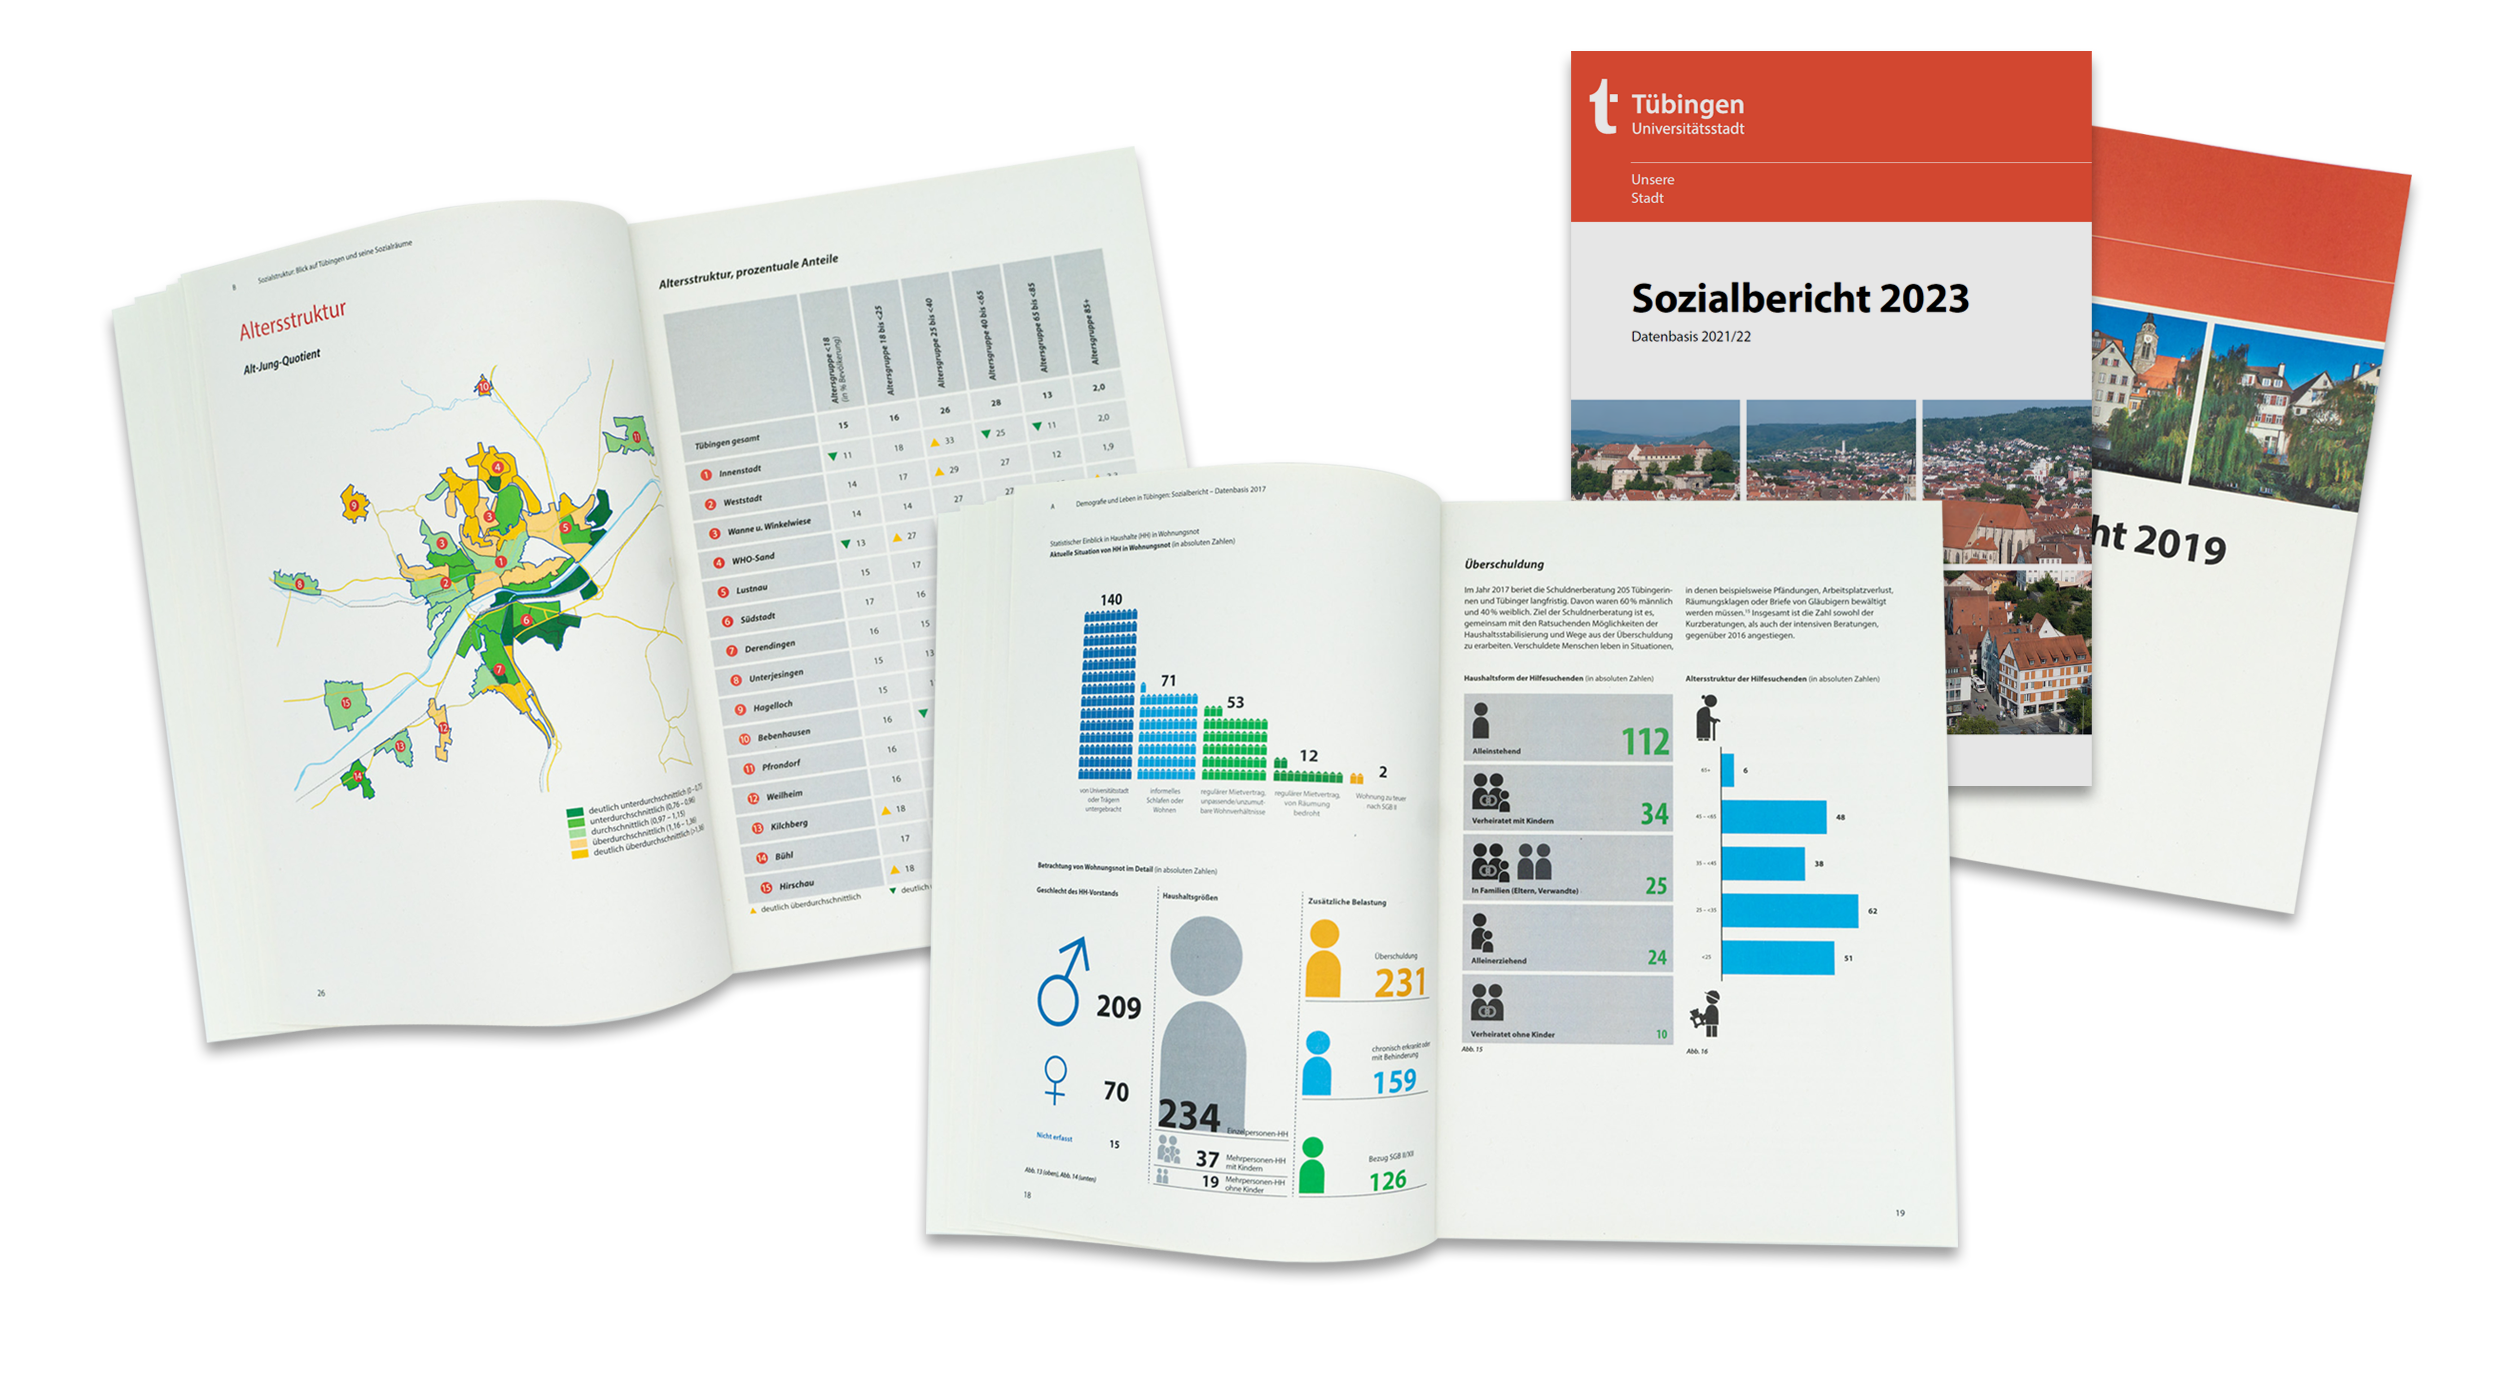
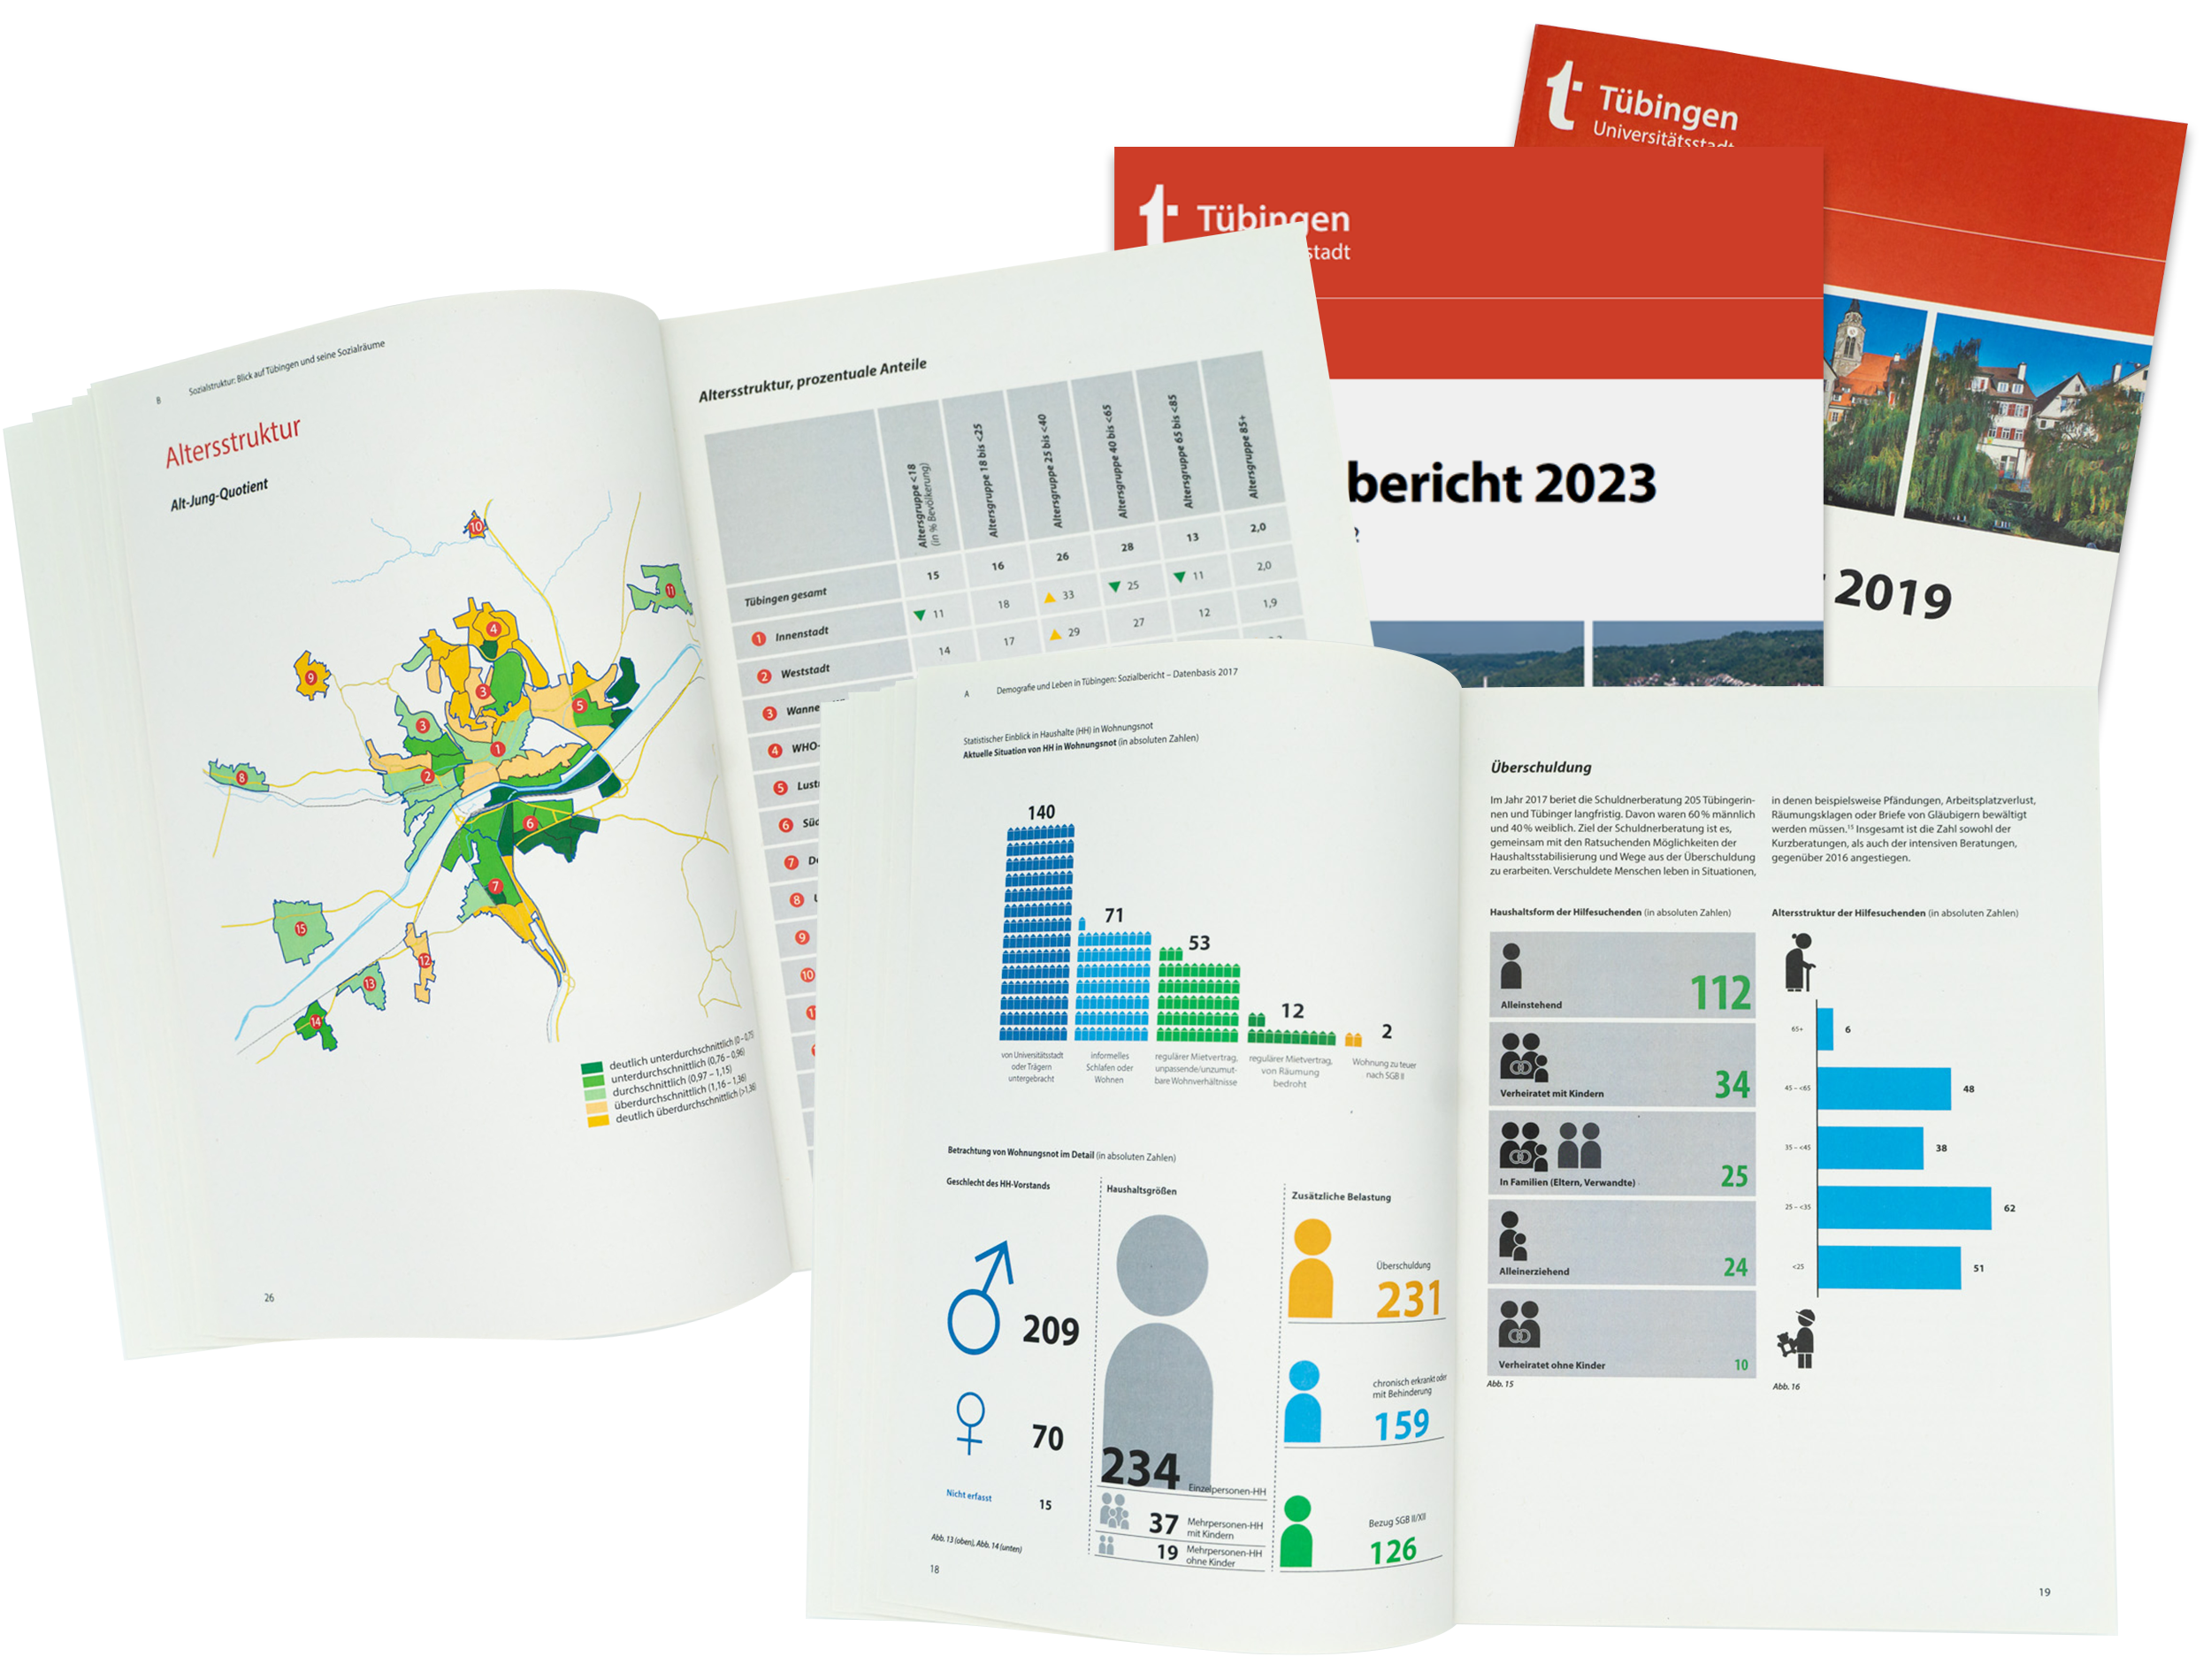

Karg und Petersen masterfully turns complex topics and data into an engaging and intuitive presentation – making our social report an intriguing read.“

Elisabeth Stauber
Head of Social Affairs // Universitätsstadt Tübingen
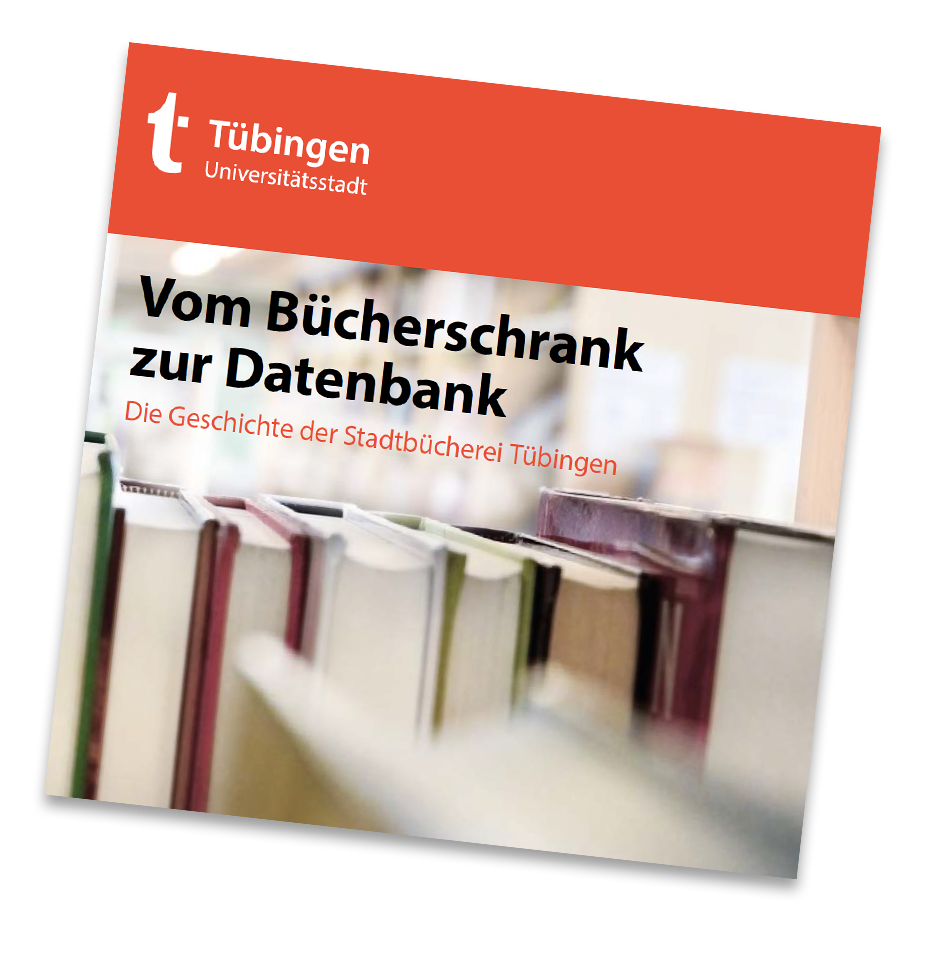
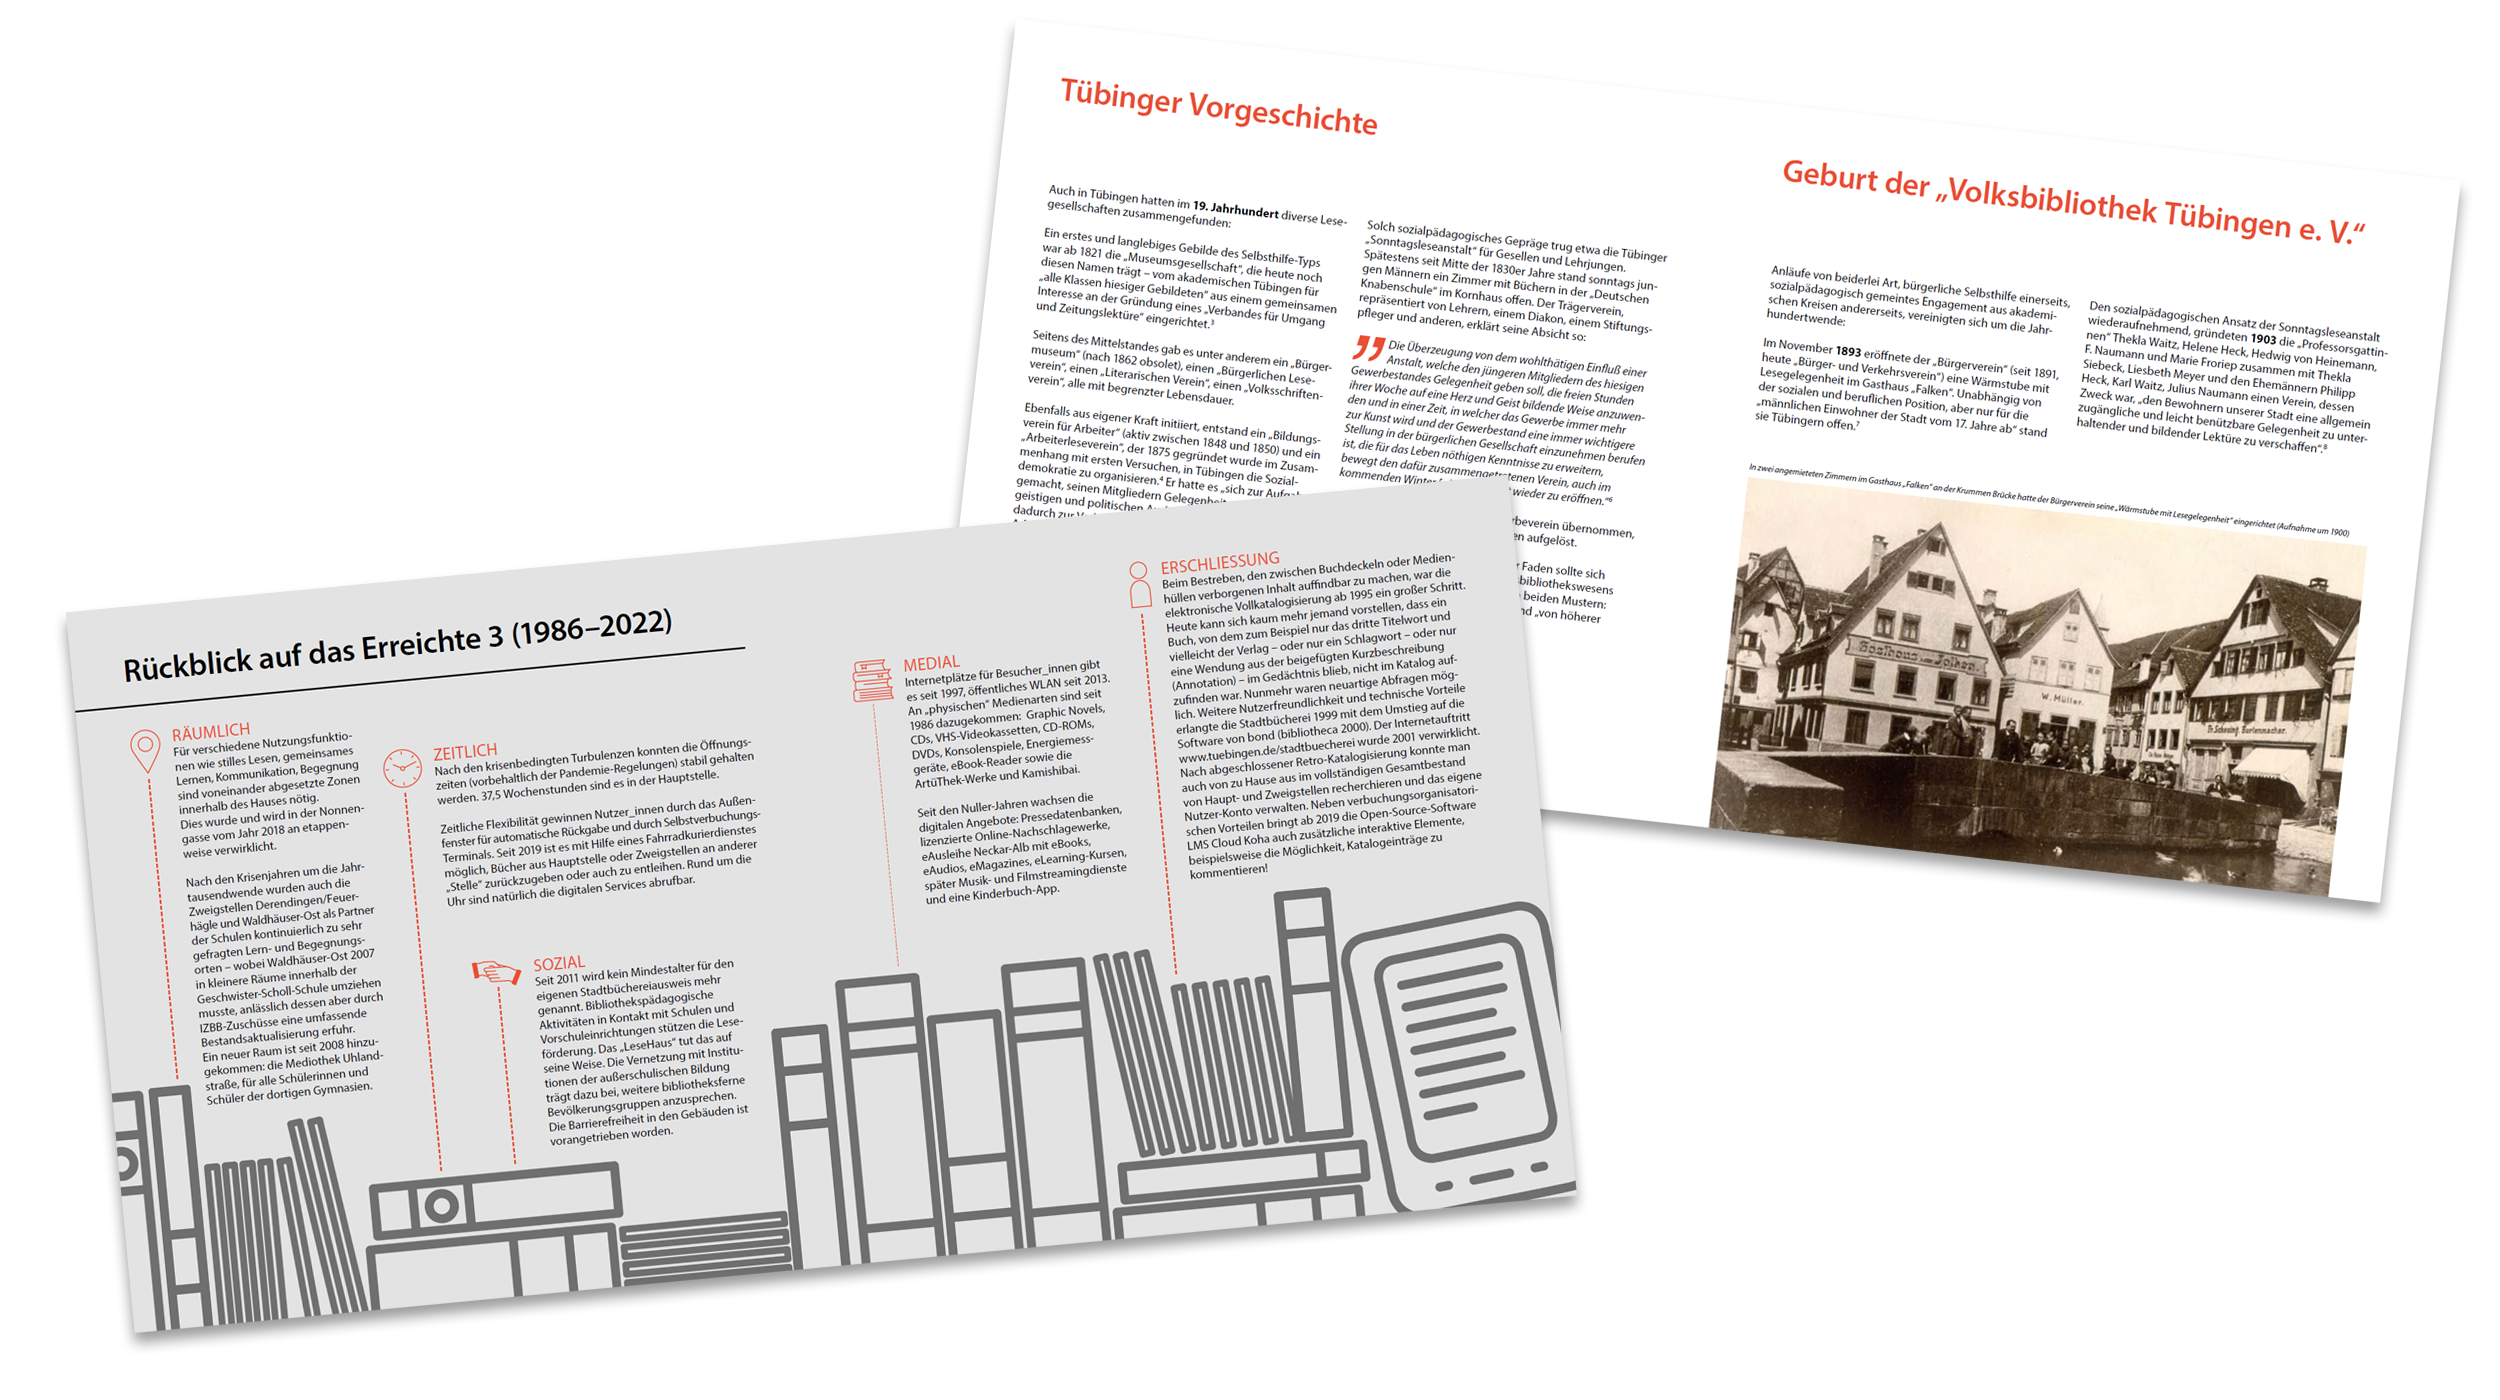
With the chronicle on the occasion of the 70th anniversary of Tübingen’s public library, we provide a publication that takes its readers on a journey: into the past, the present, and the future of the home of books in Tübingen. And, among other things, it illustrates reading and media behavior over the course of time in vivid graphics.
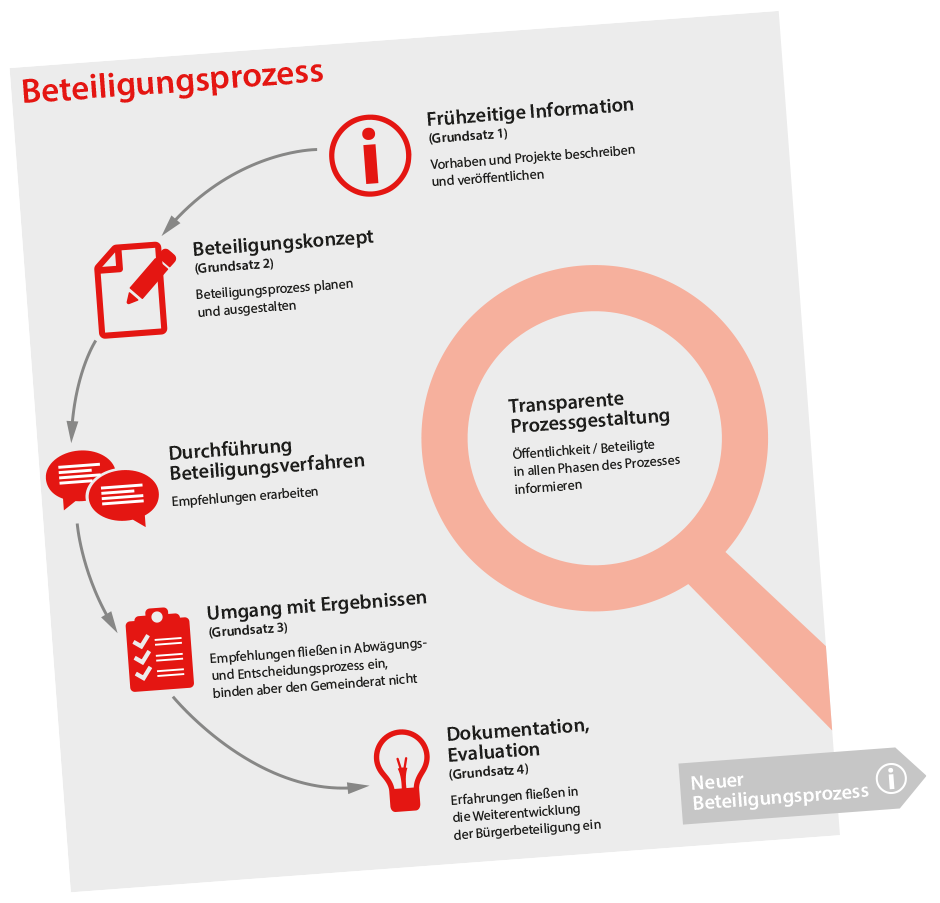
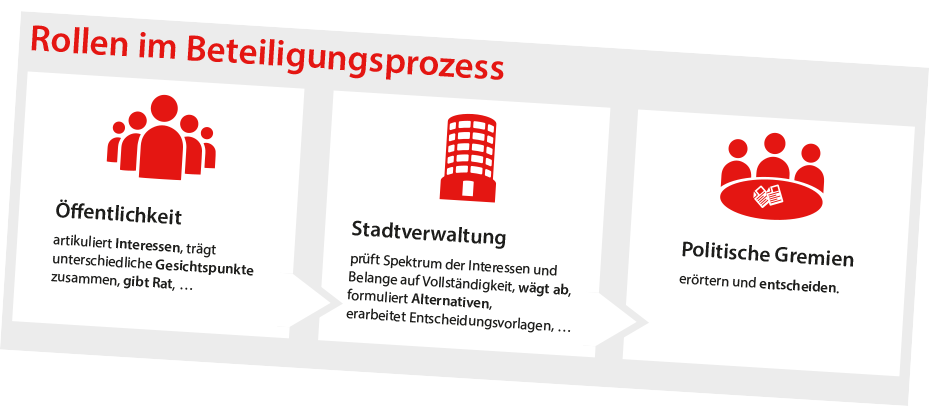
For the guide on citizen participation, we create infographics that explain the process and the most important questions around the topic in a way that is easy to understand. Thus, breaking down barriers.
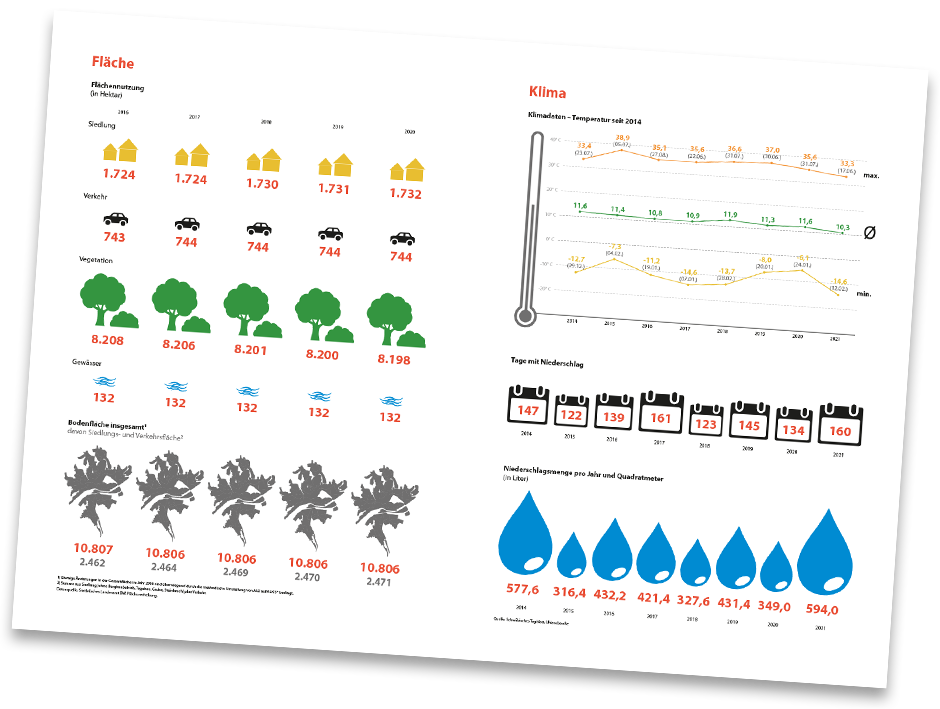
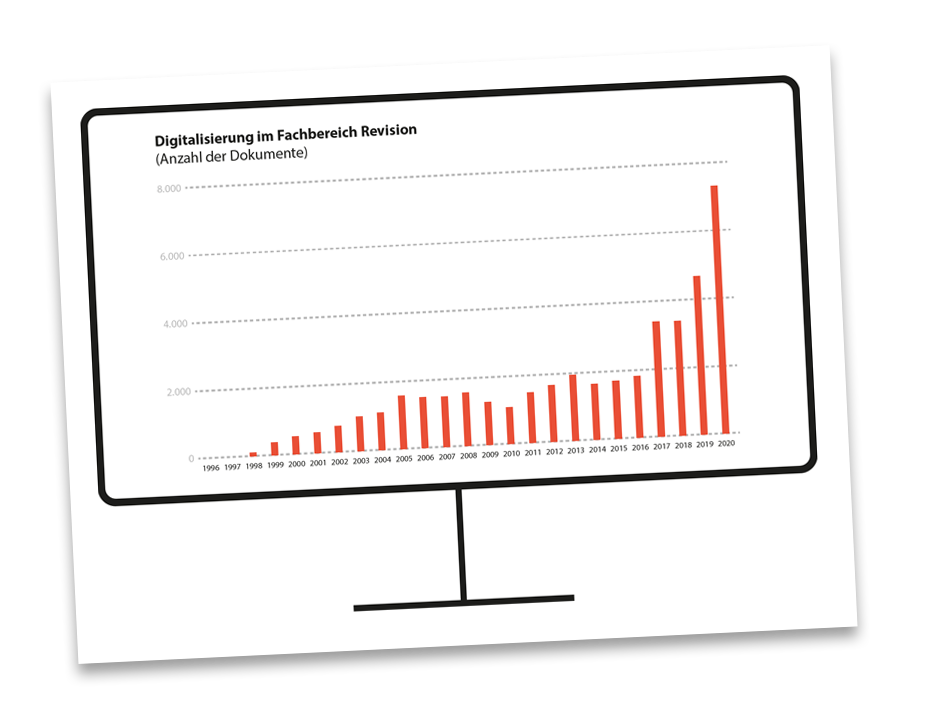
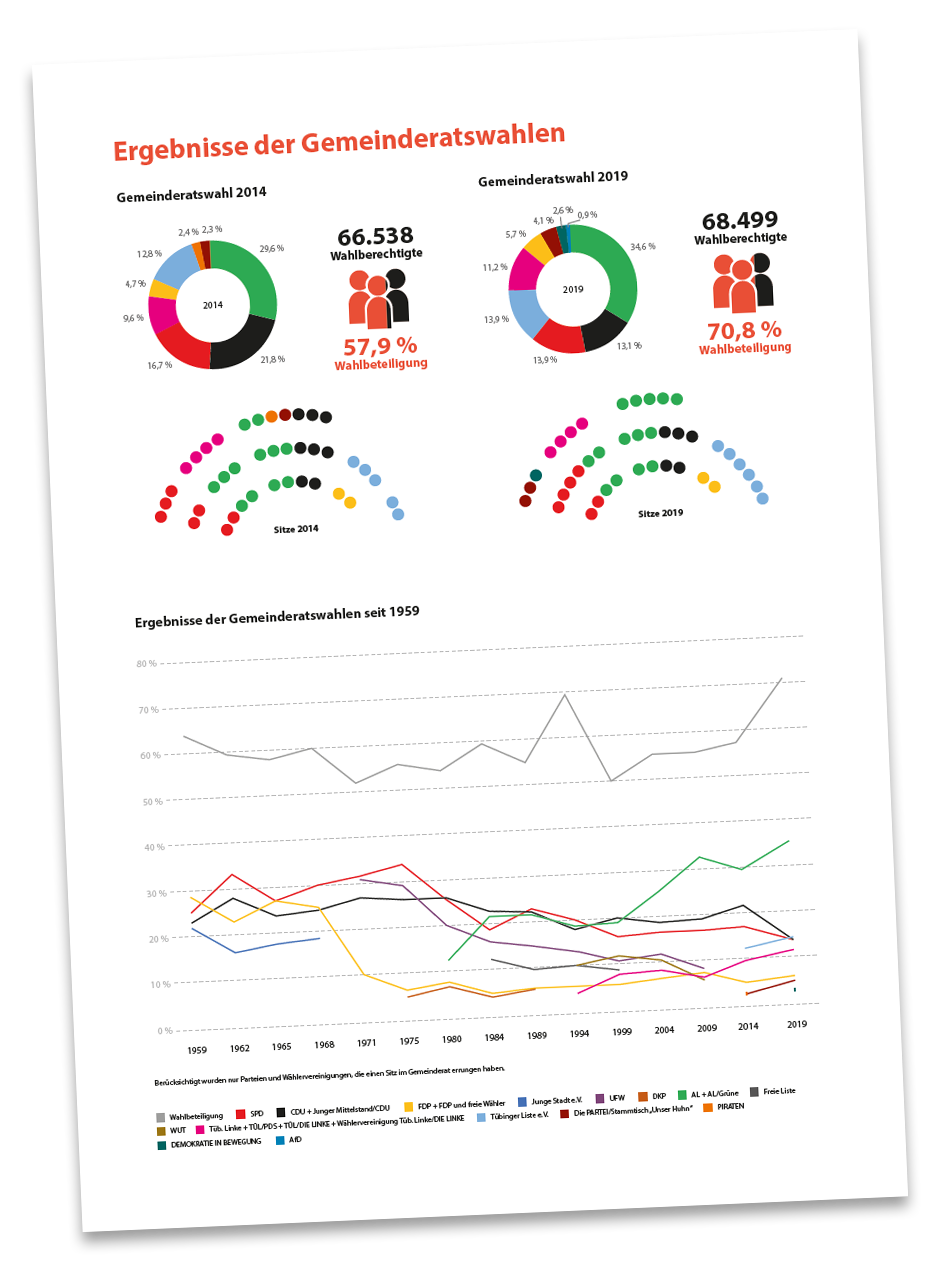
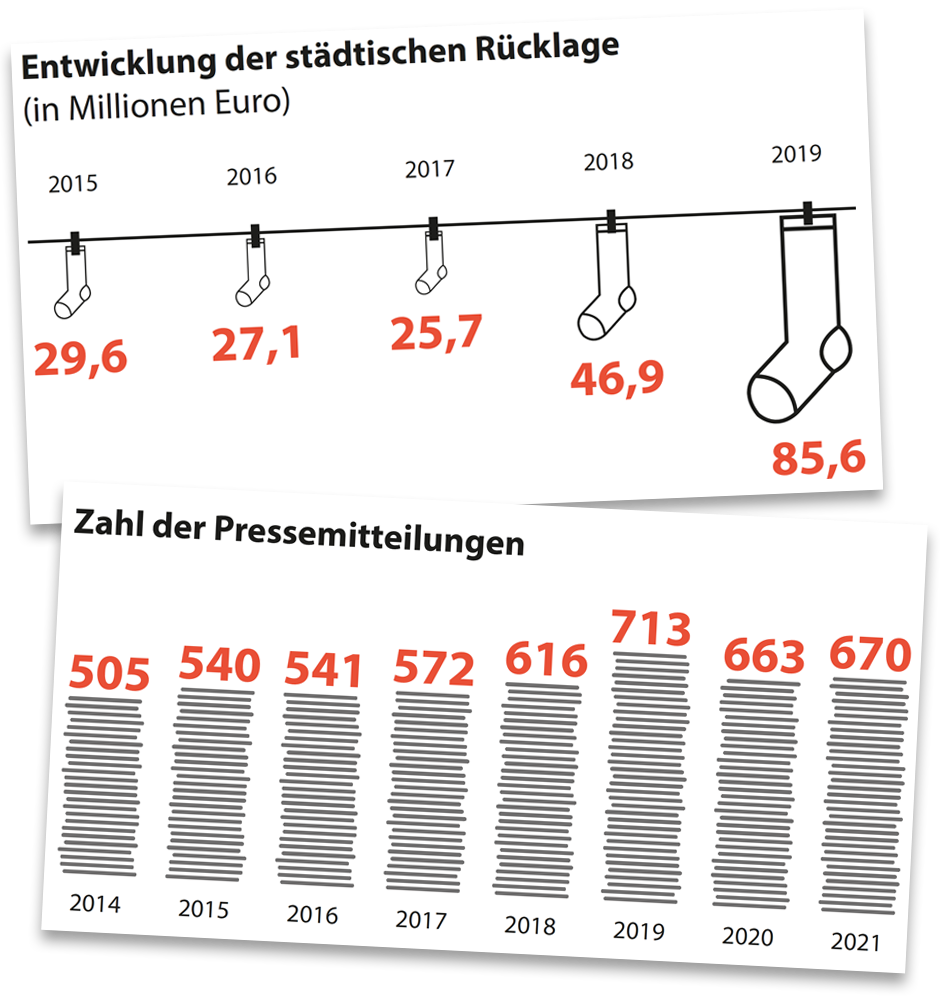
The city’s administrative report, published every eight years, contains a wealth of figures, data, and facts. Our infographics present interesting, exciting and complex information as a visual treat. And thus, lighten up the comprehensive publication.