
Due to the global trade in products that infringe trademarks and intellectual property rights (IPR) held by Swiss companies, they suffered a sales loss of about 4.45 billion Swiss francs (about 4 billion euros) in 2018, according to a recent analysis by the Organization for Economic Cooperation and Development (OECD). An estimated 10,000 jobs were lost because of this loss of revenue.
Counterfeits of Swiss products headed to a total of 55 target countries, including many European destinations, according to the study. Nearly half of all counterfeit shipments intercepted by customs authorities in 2017 to 2019 were destined for Germany (about 48 percent), followed by Belgium (14 percent), the Netherlands, the United Kingdom (UK), and Spain. Looking at the value of counterfeits seized, the UK ranks first with more than 60 percent of the seizure value, followed by Germany (11.4 percent) and the Netherlands (5.5 percent). Respective data for the USA is not available; however, the study assumes that it is likely to hold a top position.
The difference between the value and number in seizures per target country can be related to the different transport modes of the counterfeits. For example, counterfeits infringing the IP of Swiss companies which were heading for the UK were intercepted mainly in sea freight – but those that were on their way to Germany were mainly intercepted in postal shipments. Consequently, the size of the shipments varied, as the analysis states. In general, about 70 percent of all shipments of fake Swiss products contained only one counterfeit, and 84 percent of shipments contained fewer than six counterfeits.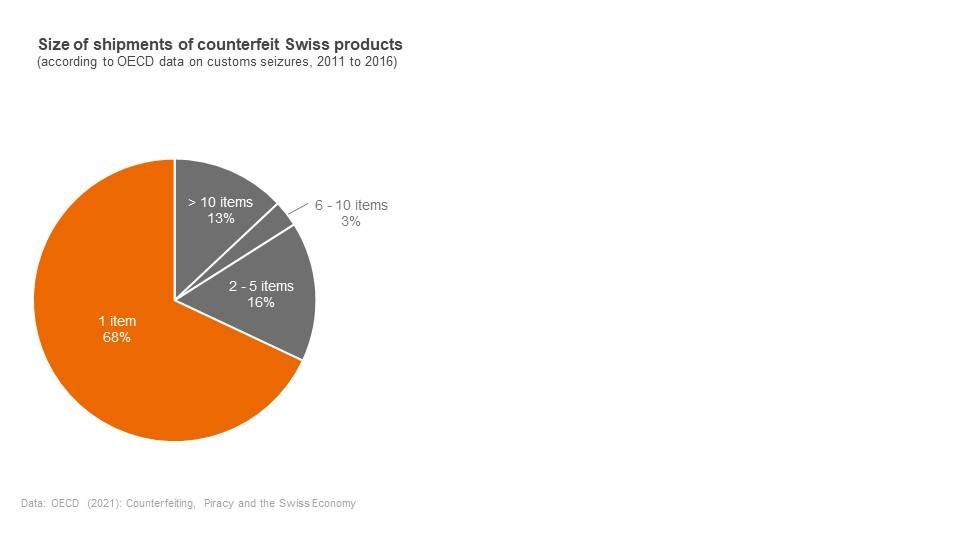 Particularly hard hit are the Swiss clothing industry and the watch and jewellery industry, according to the analysis. Counterfeit watches accounted for the majority of counterfeit seizures, with about 80 percent both in terms of number and value of seizures. Looking at the number of seizures, next to watches, fraudsters primarily copied clothing (about 11.4 percent) and footwear (3.2 percent). Based on the value of seizures, watches are followed by clothing (3.8 percent) and leather goods (2 percent).
The main provenance countries of counterfeits from 2017 to 2019 were China and Hong Kong, as well as Turkey and Singapore. In 2016, products from China accounted for 52 percent of customs seizures and goods from Hong Kong accounted for 25 percent. While in 2016, China accounted for 70 percent of the seizure value and Hong Kong 19 percent, Hong Kong’s share increased rapidly to 70 percent in 2019.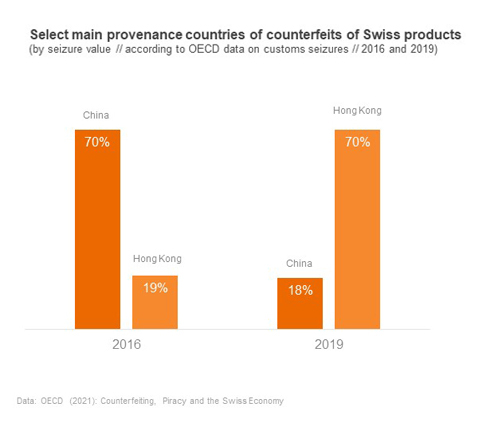
The global Covid-19 pandemic has reportedly further exacerbated the counterfeiting problem for companies from Switzerland as well. The analysis particularly highlights that criminal groups have reacted quickly to new circumstances. For example, they had increasingly used unusual transport routes via Africa and Latin America when routes through Asia had become blocked due to lockdowns. In addition, there seems to be an increase in counterfeit Swiss products in e-commerce and in trade via social media. In 2020 alone, for example, the Internet Enforcement Team of the Federation of the Swiss Watch Industry FH had 1.2 million counterfeit watches removed from online marketplaces. Next to watches, counterfeit products from the mechanical engineering, electrical, and metal industries are also traded on the Internet, as well as fake FMCGs (fast moving consumer goods) and pharmaceuticals.
The OECD study Counterfeiting, Piracy and the Swiss Economy, published in March 2021, analyzes data on seizures from e.g. the World Customs Organization (WCO), the EU Directorate-General for Taxation and Customs Union (DG TAXUD), and the U.S. Customs and Border Protection (CBP), among others, as well as trade data from the United Nations Comtrade database.

